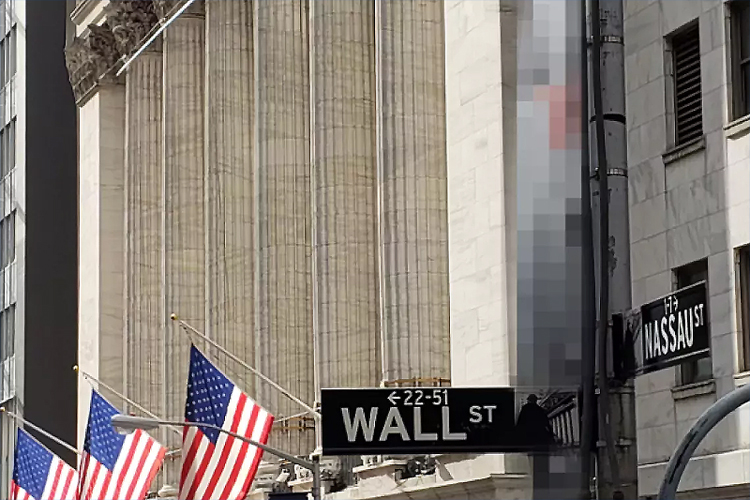

The benchmark S&P 500 finished up 0.6%, closing above 7800 for the first time ever, and both the tech-heavy NASDAQ Composite and Dow Jones Industrial Average were up 0.5%. The NASDAQ hit back-to-back new records.
However, with tech stocks often contributing to rises, and a kind of PR mania frothing over so-called “AI,” real or imagined, one would have to “drill down” to see just how representative the aggregate trends were for stocks generally in other sectors and industries.
Meanwhile, the 10-year Treasury yield, benchmark for mortgage rates, corporate bond rates, and interest rates on various loans, had risen above 5.35% Monday, its highest rate since early April 2002, but fell back slightly Tuesday to 5.28% by late afternoon, approximately three basis points lower than Monday’s close.
On the energy front, even as the pace of tanker shipments through the Strait of Hormuz increased, Houthi attacks on Saudi Arabia, and perhaps general Middle East uncertainty, still saw oil prices rise. U.S. benchmark West Texas Intermediate (WTI) crude futures rose by 0.4% to $89.80 per barrel by late afternoon ET. International benchmark Brent crude futures rose even higher, by 0.7% to $101 in a similar time frame.
The U.S. dollar index fell 0.2% against a selection of foreign currencies to $101.86 late afternoon ET. Gold futures climbed 1% to $4,195 per ounce late afternoon.
Wednesday afternoon at 2 p.m. ET, the Federal Reserve is to set to release minutes from last month’s Federal Open Market Committee meeting. Observers conceivably might look to the new information to shed light on the thinking of current officials with regard to monetary policy, the mid-September interest rate hike and future prospects for financial actions by the Fed.
In the News
- S&P 500, Nasdaq Close at Record Highs; Oil Prices, Treasury Yields, Bond Yields Fall – Investopedia
- S&P 500 back in record territory as ‘Magnificent Seven’ ride to the rescue – Morning Star/Dow Jones
- Stock futures are little changed after S&P 500 hits fresh record: Live updates – CNBC
- Trading Day: Running with the bulls – Reuters
- S&P 500, Nasdaq close at record highs as tech stocks surge and Treasury yields fall – MarketWatch
- S&P 500 posts first close above 7,800, boosted by tech gains and cooler yields – CNBC
- S&P 500, Nasdaq hit record highs as Nvidia, AMD lead tech higher; Stocks continued to march higher despite elevated bond yields – yahoo
- Record Run for US Stocks to Set Tone for Asia: Markets Wrap – Bloomberg
- U.S. stocks rise to a record on expectations companies will make even fatter profits – AP/Pittsburg Post-Gazette
- Chart: A look at the S&P 500′s remarkable and defiant trip to a new record – CNBC
- Why the Surging Dollar Is Defying Bond Market Stress — and What It’s Signaling; The greenback went from debasement to dominance this year. Is that necessarily good? U.S. Dollar Index up 6% this year, tracks dollar against basket of six major currencies — Euro, British Pound, Japanese Yen, Canadian Dollar, Swiss Franc, Swedish Krona – Barron’s
- 3 Growth Stocks to Buy Instead of SpaceX; SpaceX (SPCX) trades at lofty valuation, even accounting for projected $100 billion in annual recurring revenue; three picks that look more attractive — Sandisk (SNDK), MaxLinear (MXL), nVent (NVT) – Motley Fool
- Trade deficit hits $105.6 billion, widest since just before Trump tariffs enacted last year – CNBC
- U.S. trade deficit reached $105.6 billion in August, as companies imported goods related to data centers and dealt with tariff impacts – UPI
- U.S. International Trade in Goods and Services, August 2026 – BEA
- Oil Steadies With Focus on Hormuz Shipments and Vessel Attacks – Bloomberg
- Child Predators Turn to Open-Source AI to Make Unlimited Illegal Images; Once models downloaded, illegal acts almost impossible to track – Bloomberg
- Markets – Morningstar
- NASDAQ Composite Index (COMP) – NASDAQ
- NASDAQ 100 – NASDAQ
- S&P 500 – Yahoo Finance
- U.S. Stock Market Today – Fox
- Stock Market Indexes Today – Motley Fool
- Dow Jones Industrial Average – Yahoo Finance
- Dow Jones Industrial Average – S&P Global DJIA
- NYSE Composite – New York Stock Exchange
- U.S. 10 Year Treasury Note – MarketWatch
- CME Group West Texas Intermediate (WTI) Light Sweet Crude Oil futures
- ICE Brent Crude Futures
- U.S. Dollar Index (DXI) – MarketWatch
- Gold futures – CME
- [PDF] S&P Global US Flash PMI®; Business growth surges to fastest for over five years and job gains accelerate, but price pressures also intensify amid spike in costs – SPC GlobalPMI by S&P Global
- Federal Reserve Calendar
- Federal Reserve
- Consumer Spending – Bureau of Economic Affairs
- Consumer Price Index – BLS
- U.S. Jobs Reports – Current Employment Statistics – CES (National) – Bureau of Labor Statistics
- U.S. Economy at a Glance – Bureau of Economic Analysis (BEA), U.S. Department of Commerce