Artist's Rendition of Stock Market Chart with Line Graph and Numbers adapted from uscc.gov image

Markets Thursday 11.12.26 – NASDAQ, S&P 500 and Dow all fall around one-third of a percent; 10-Year Treasury Yield jumps on inflation-fueled rate-hike fears; Oil climbs back; Dollar rises, Gold falls – Videos, NewsLinks, Info

Overview – Videos – In the News – More Resources Thursday trading was volatile, in part after Nvidia’s dismissal of[…]

Read more


Artist's Rendition of Stock Market Chart with Line Graph and Numbers adapted from uscc.gov image

S&P 500 and NASDAQ hit new records, Dow also up; Oil and Gold up, 10-year Treasury yield retreats slightly from climb; Dollar down – Markets Tuesday 10.6.26 – Videos, NewsLinks, Info

The benchmark S&P 500 finished up 0.6%, closing above 7800 for the first time ever, and both the tech-heavy NASDAQ[…]

Read more
Artist's Rendition of Stock Market Chart with Line Graph and Numbers adapted from uscc.gov image

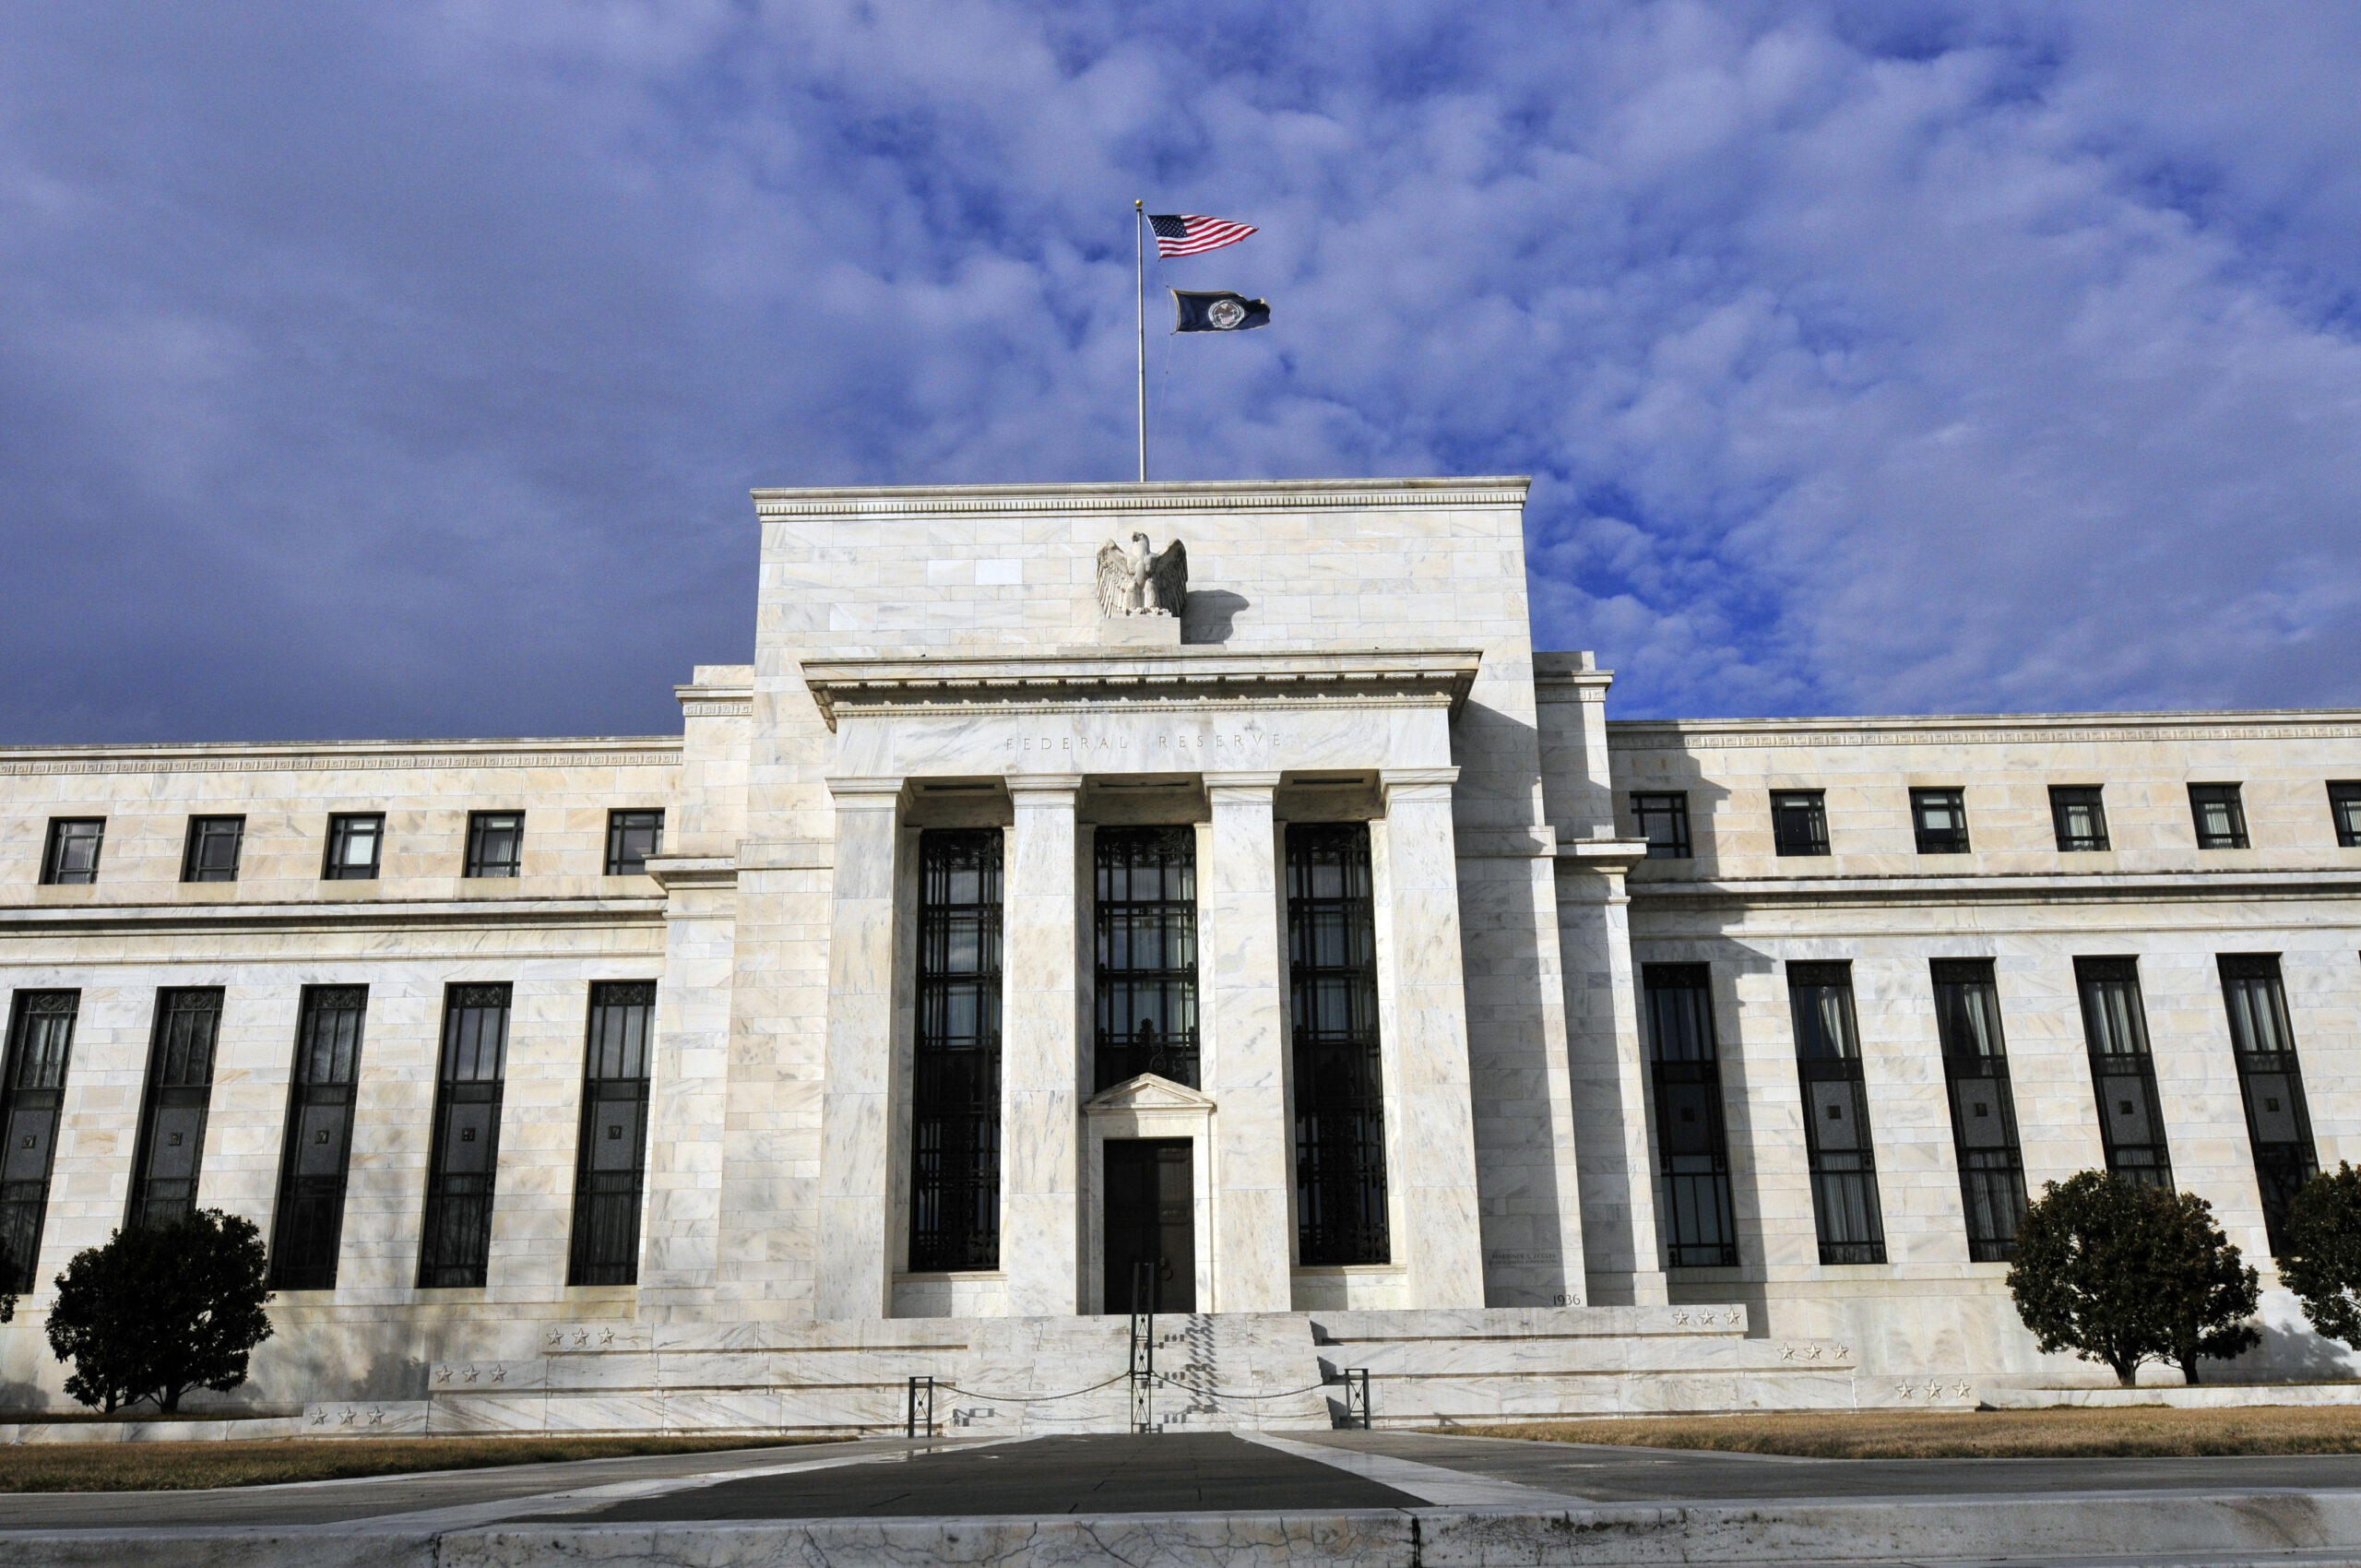
Thursday 9.17.26 – Tech stocks lead U.S. stock markets’ resurgence, bouncing back after post-Fed decline; NASDAQ, S&P 500, Dow all gain; oil dips; 10-year Treasury yield declines

Major U.S. stock indexes recovered Thursday, a day after declines following the Federal Reserve’s Wednesday announcement that it is unanimously[…]

Read more